While some papers in the past have utilized Google Trend data to capture interest in a topic or track the spread of disease, we use a close variant in our work based on data from Keywords Everywhere.8 This tool combines data from Google Trends with some of Google’s other database information such as Keyword Planner to retrieve raw search volumes. This makes it easier to compare across justifications over time since the data is not normalized by other searches in the region during the period to get a measure of popularity.9
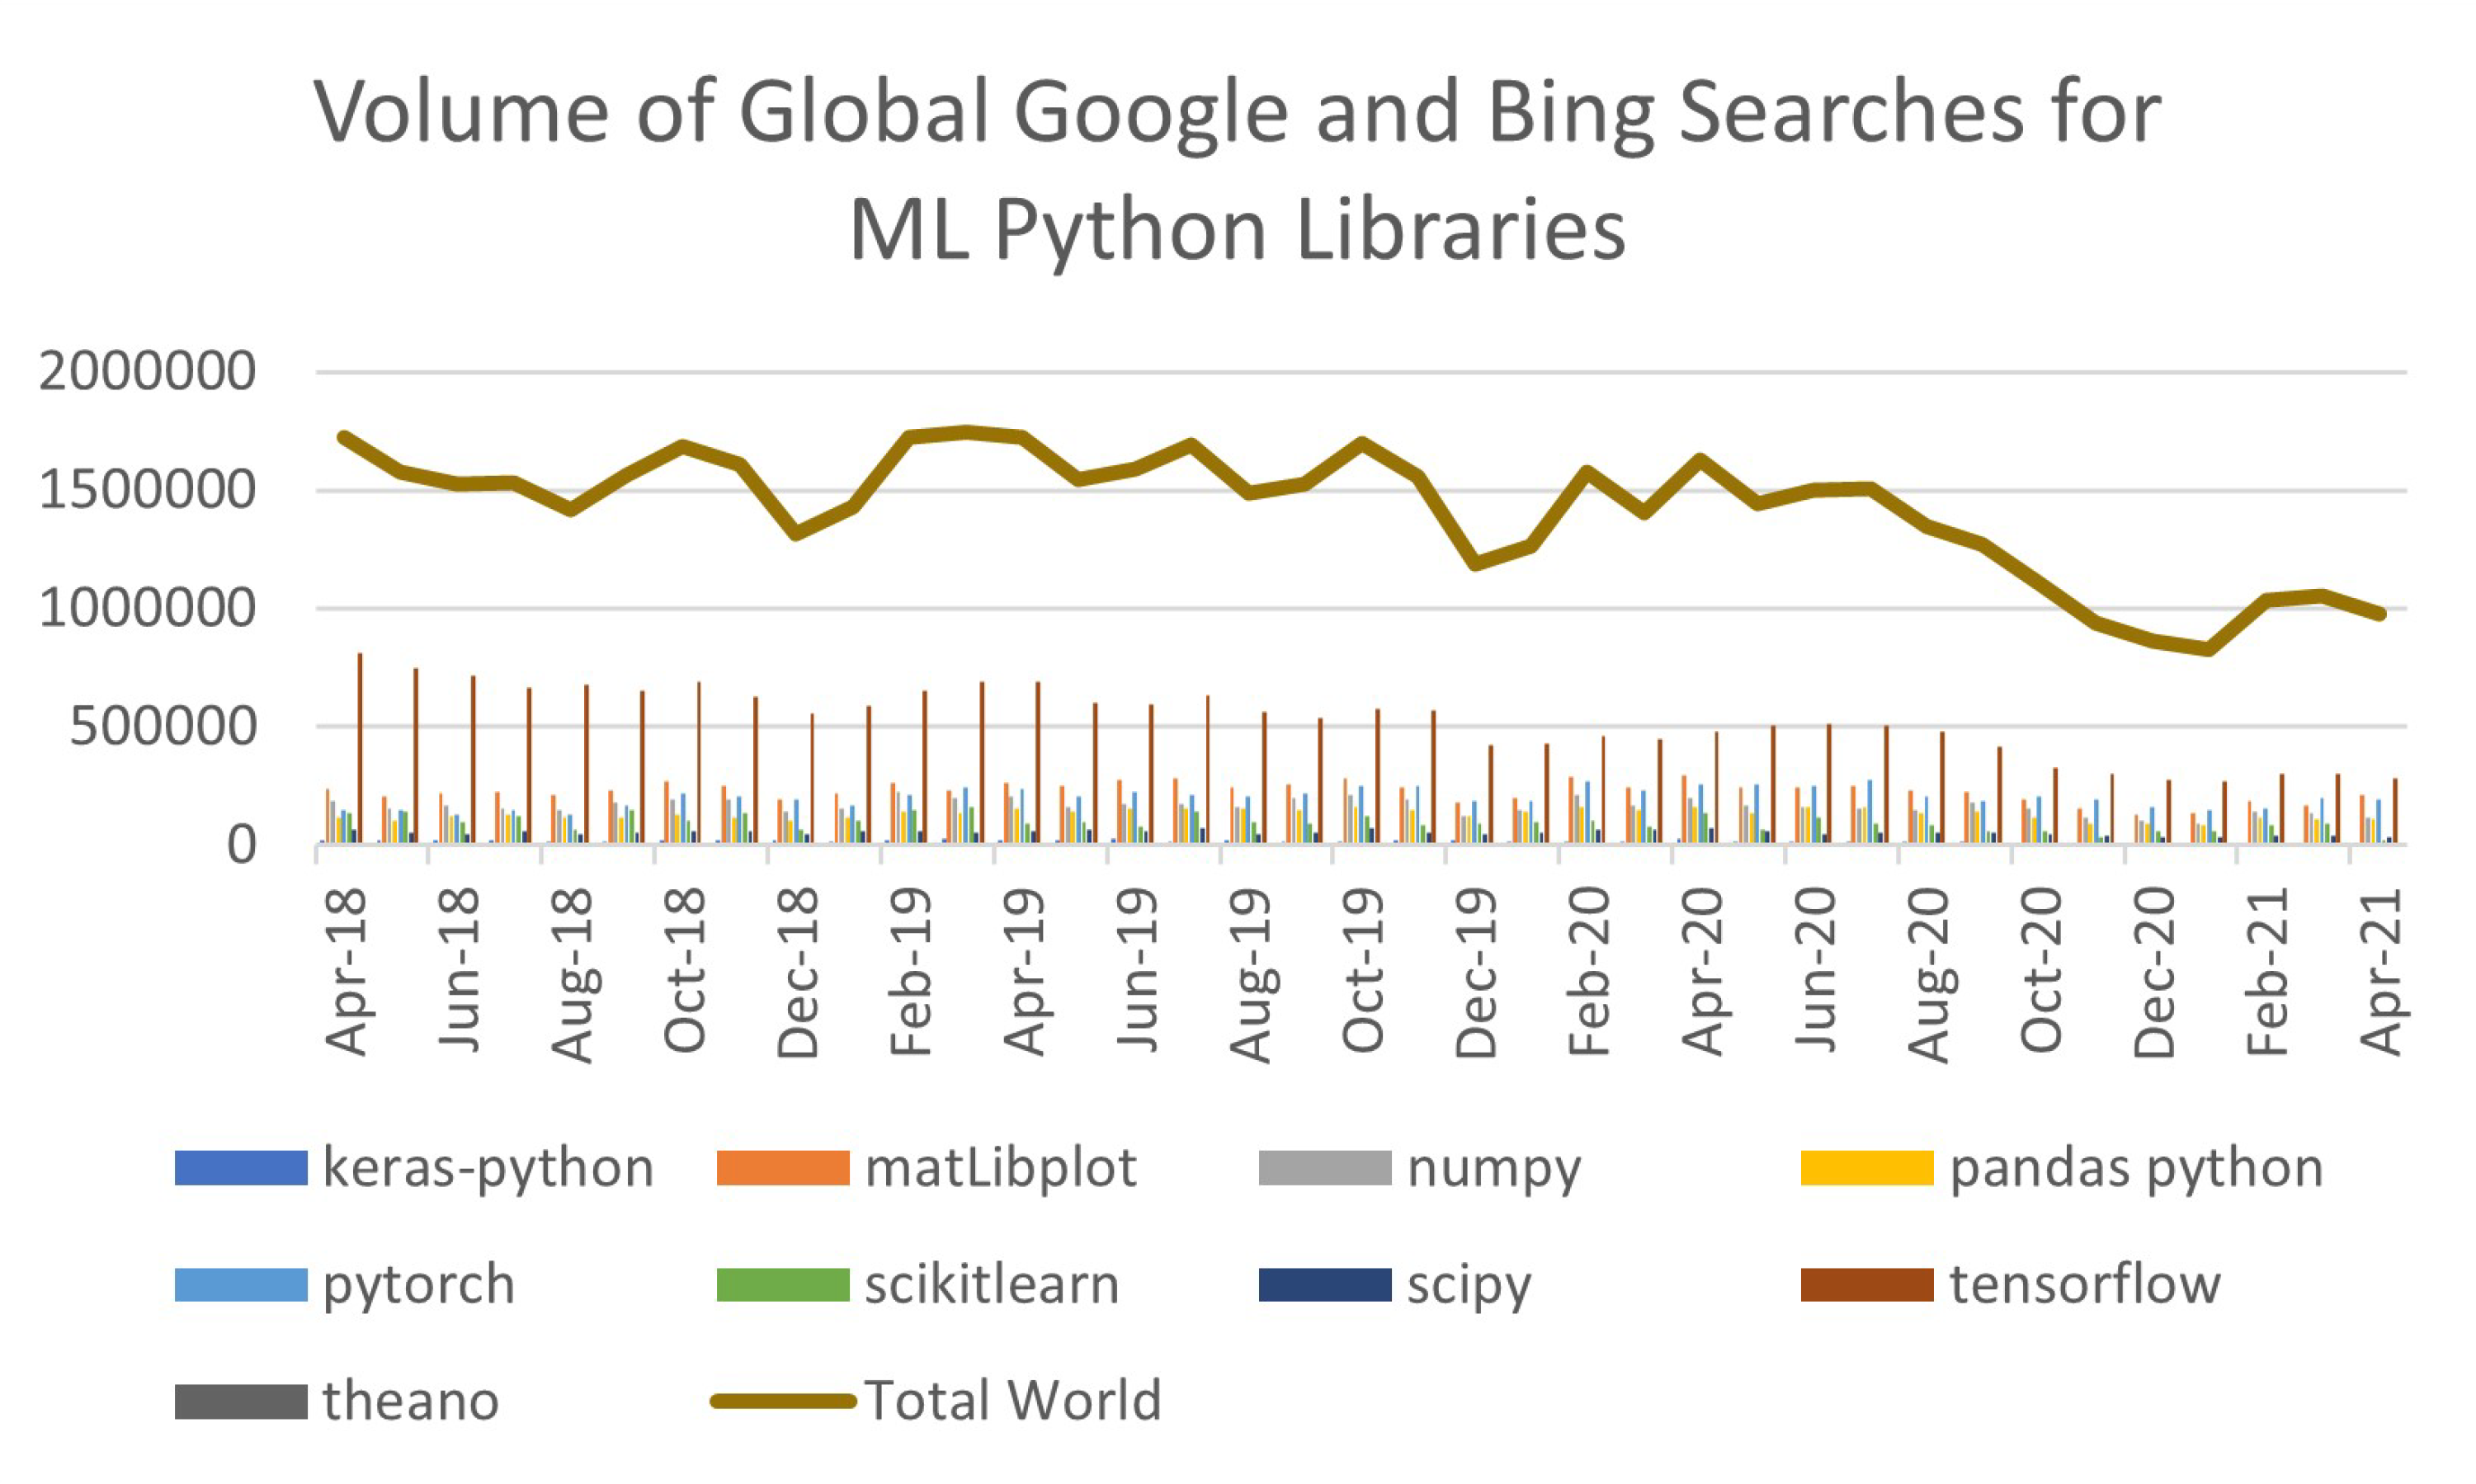
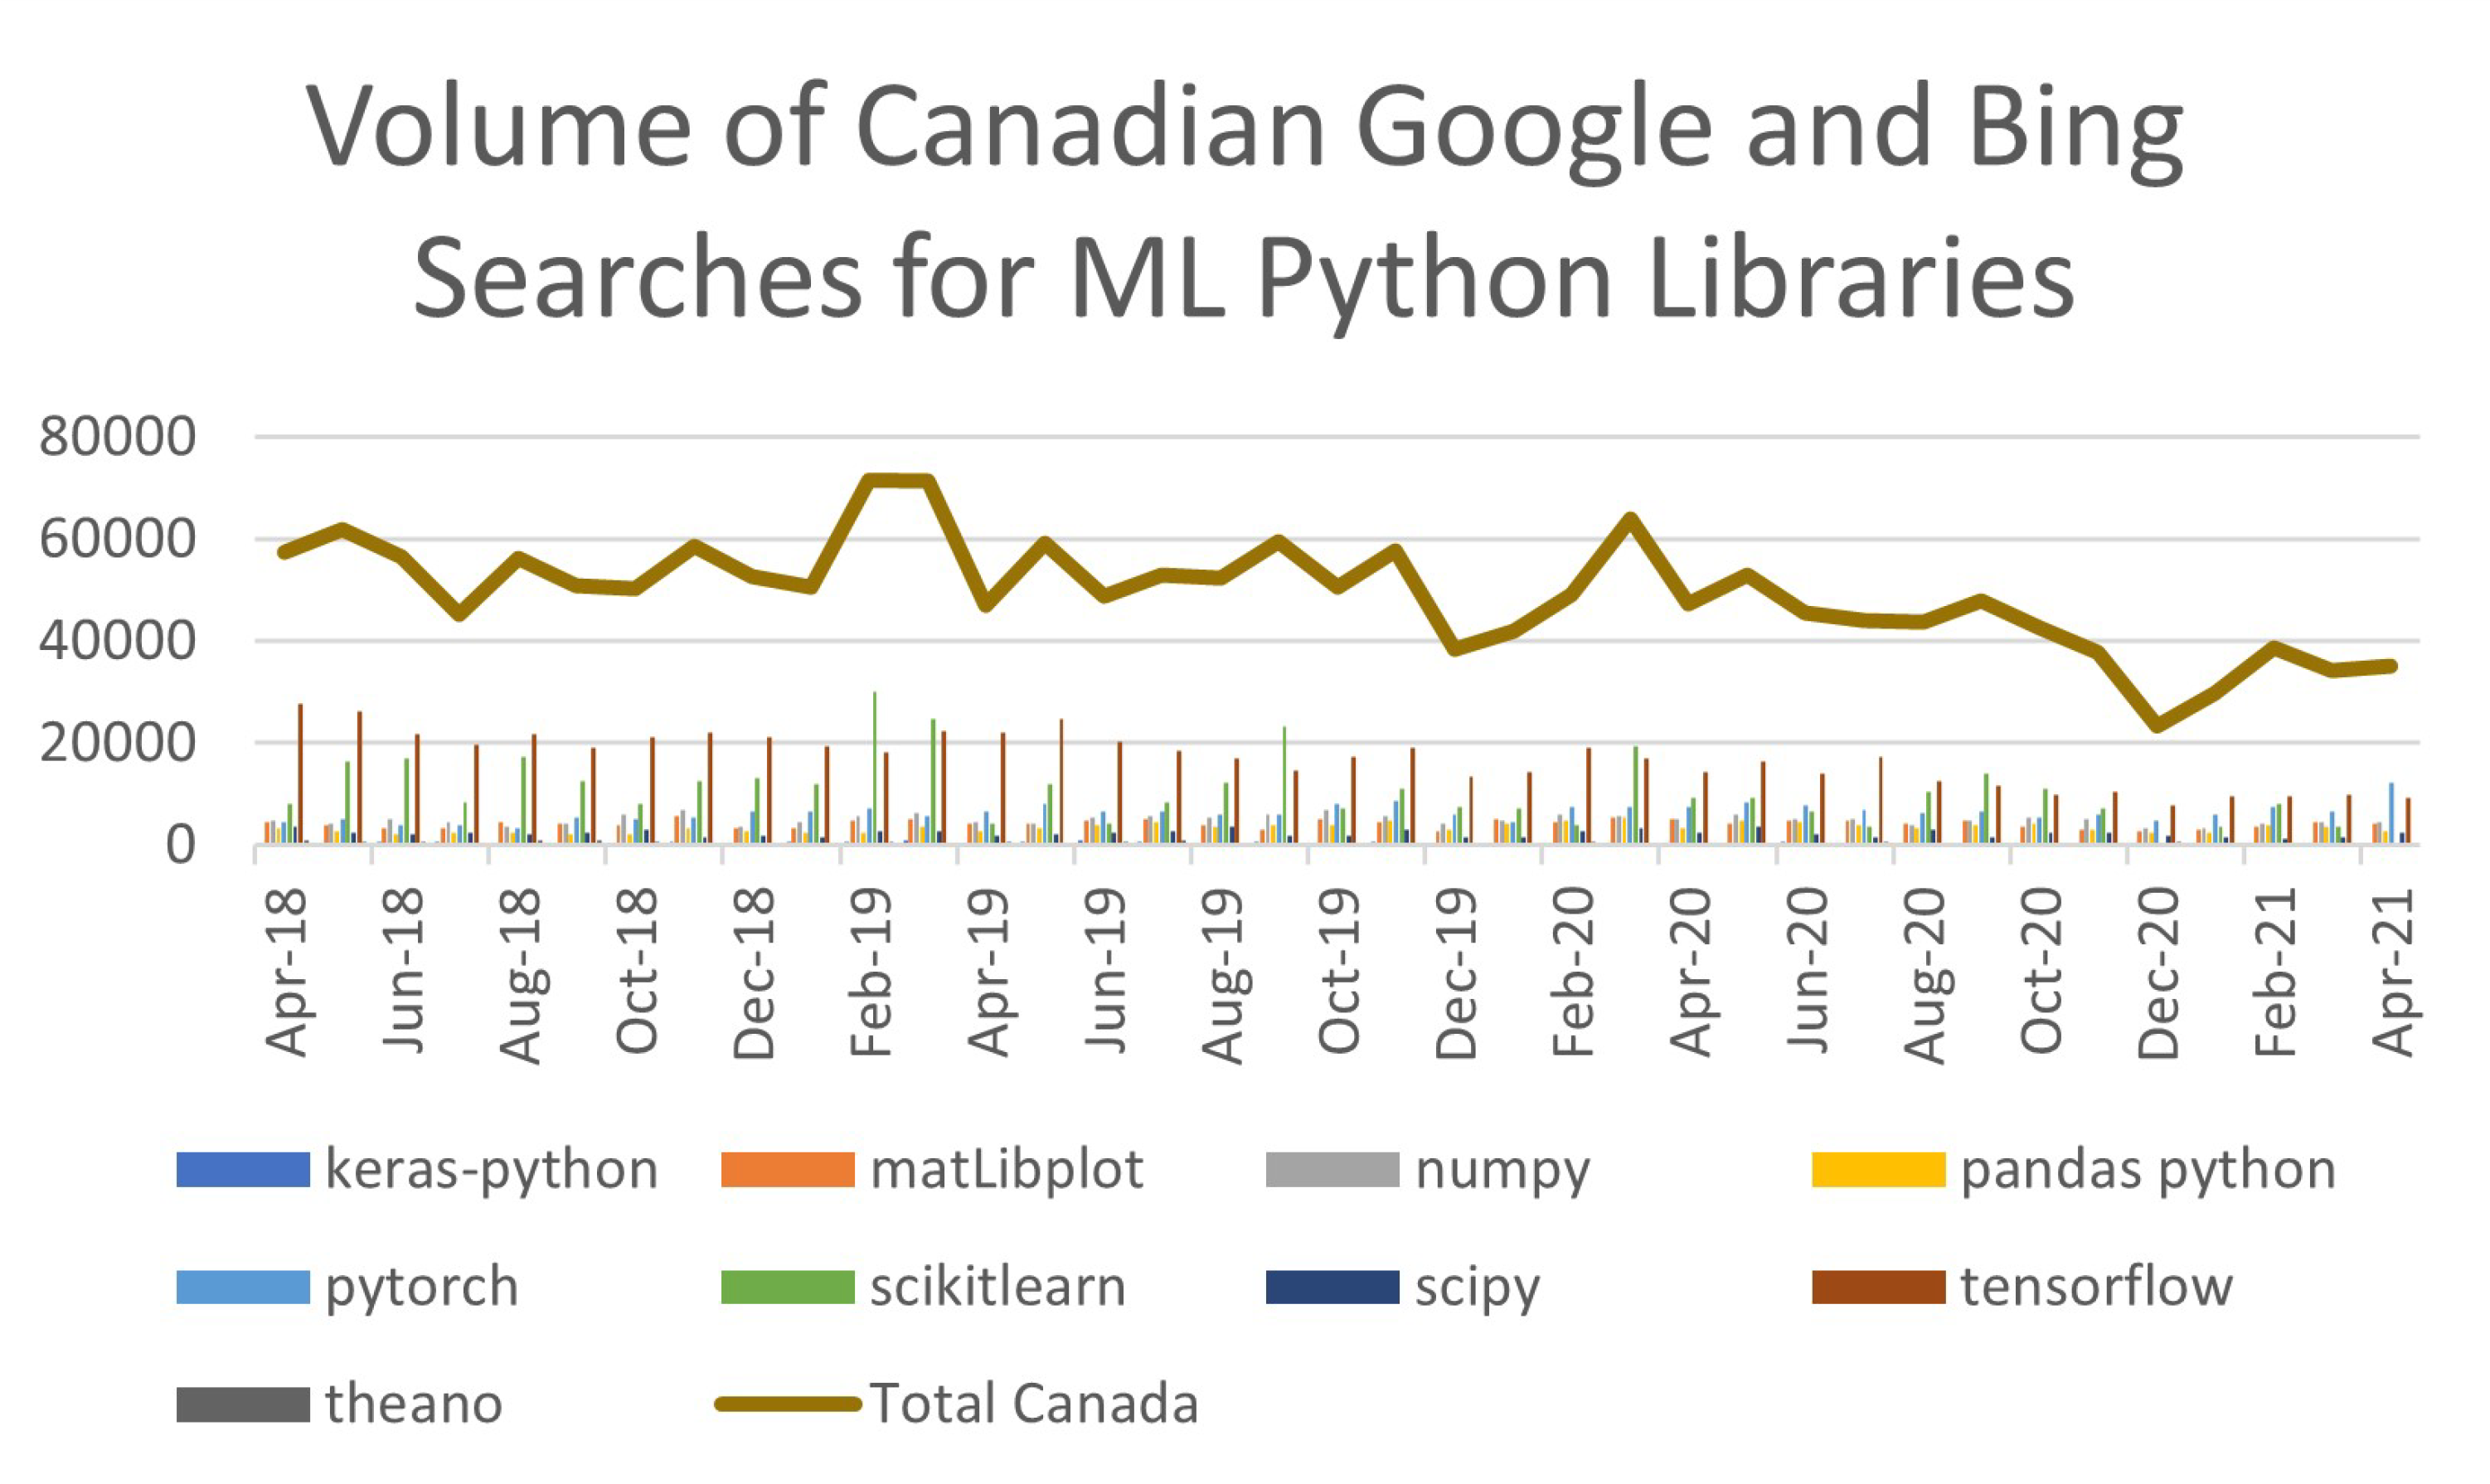
For our investigation we collect monthly Google and Bing search volume data (worldwide and Canada specific) for popular ML Python package names from April from 2017 to April 2021. Figure 1 shows the trend over time of the number of searches by package name worldwide and Figure 2 shows the same for Canada only. We again see signs of a potential disruption in activities due to COVID-19. The volume of Google and Bing searches for ML Python package names decreased during the months of the pandemic. Global search data shows a steady decline in the volume of searches starting in April 2020 whereas, in Canada, the volume of searches starts to decline in March 2020 during the peak of the first wave of the pandemic in this country. In both cases, there is a small increase in search volume after the annual drop in December 2020 but overall searches remain below the pre-pandemic volume. Given that search behaviour changes across dates is expected to be correlated with changes in interest in the use of these data science related packages, it would appear that these numbers signal a potential disruption in data science system development which may indicate a delay in commercialization and diffusion of data science innovations
While there are multiple sources where one can download ML related python libraries, we explored statistics from Anaconda’s conda stats.10 We chose this source since Anaconda is touted as the world’s most popular data science platform with over 25 million users across 235 regions currently reported, and over 2.4 billion package downloads in 2019.11 Its popularity is at least partly attributable to Anaconda’s Python distribution bringing many of the tools used in data science and ML with just one install.12. The statistics on package downloads from condatstats for the tensorflow, pytorch and keras packages, displayed in Figure 3 over the period Jan 2019-December 2021 appear to follow the same downward trend following the COVID-19 surge in cases in early 2020 (Note: this data was downloaded on March 9, 2021).
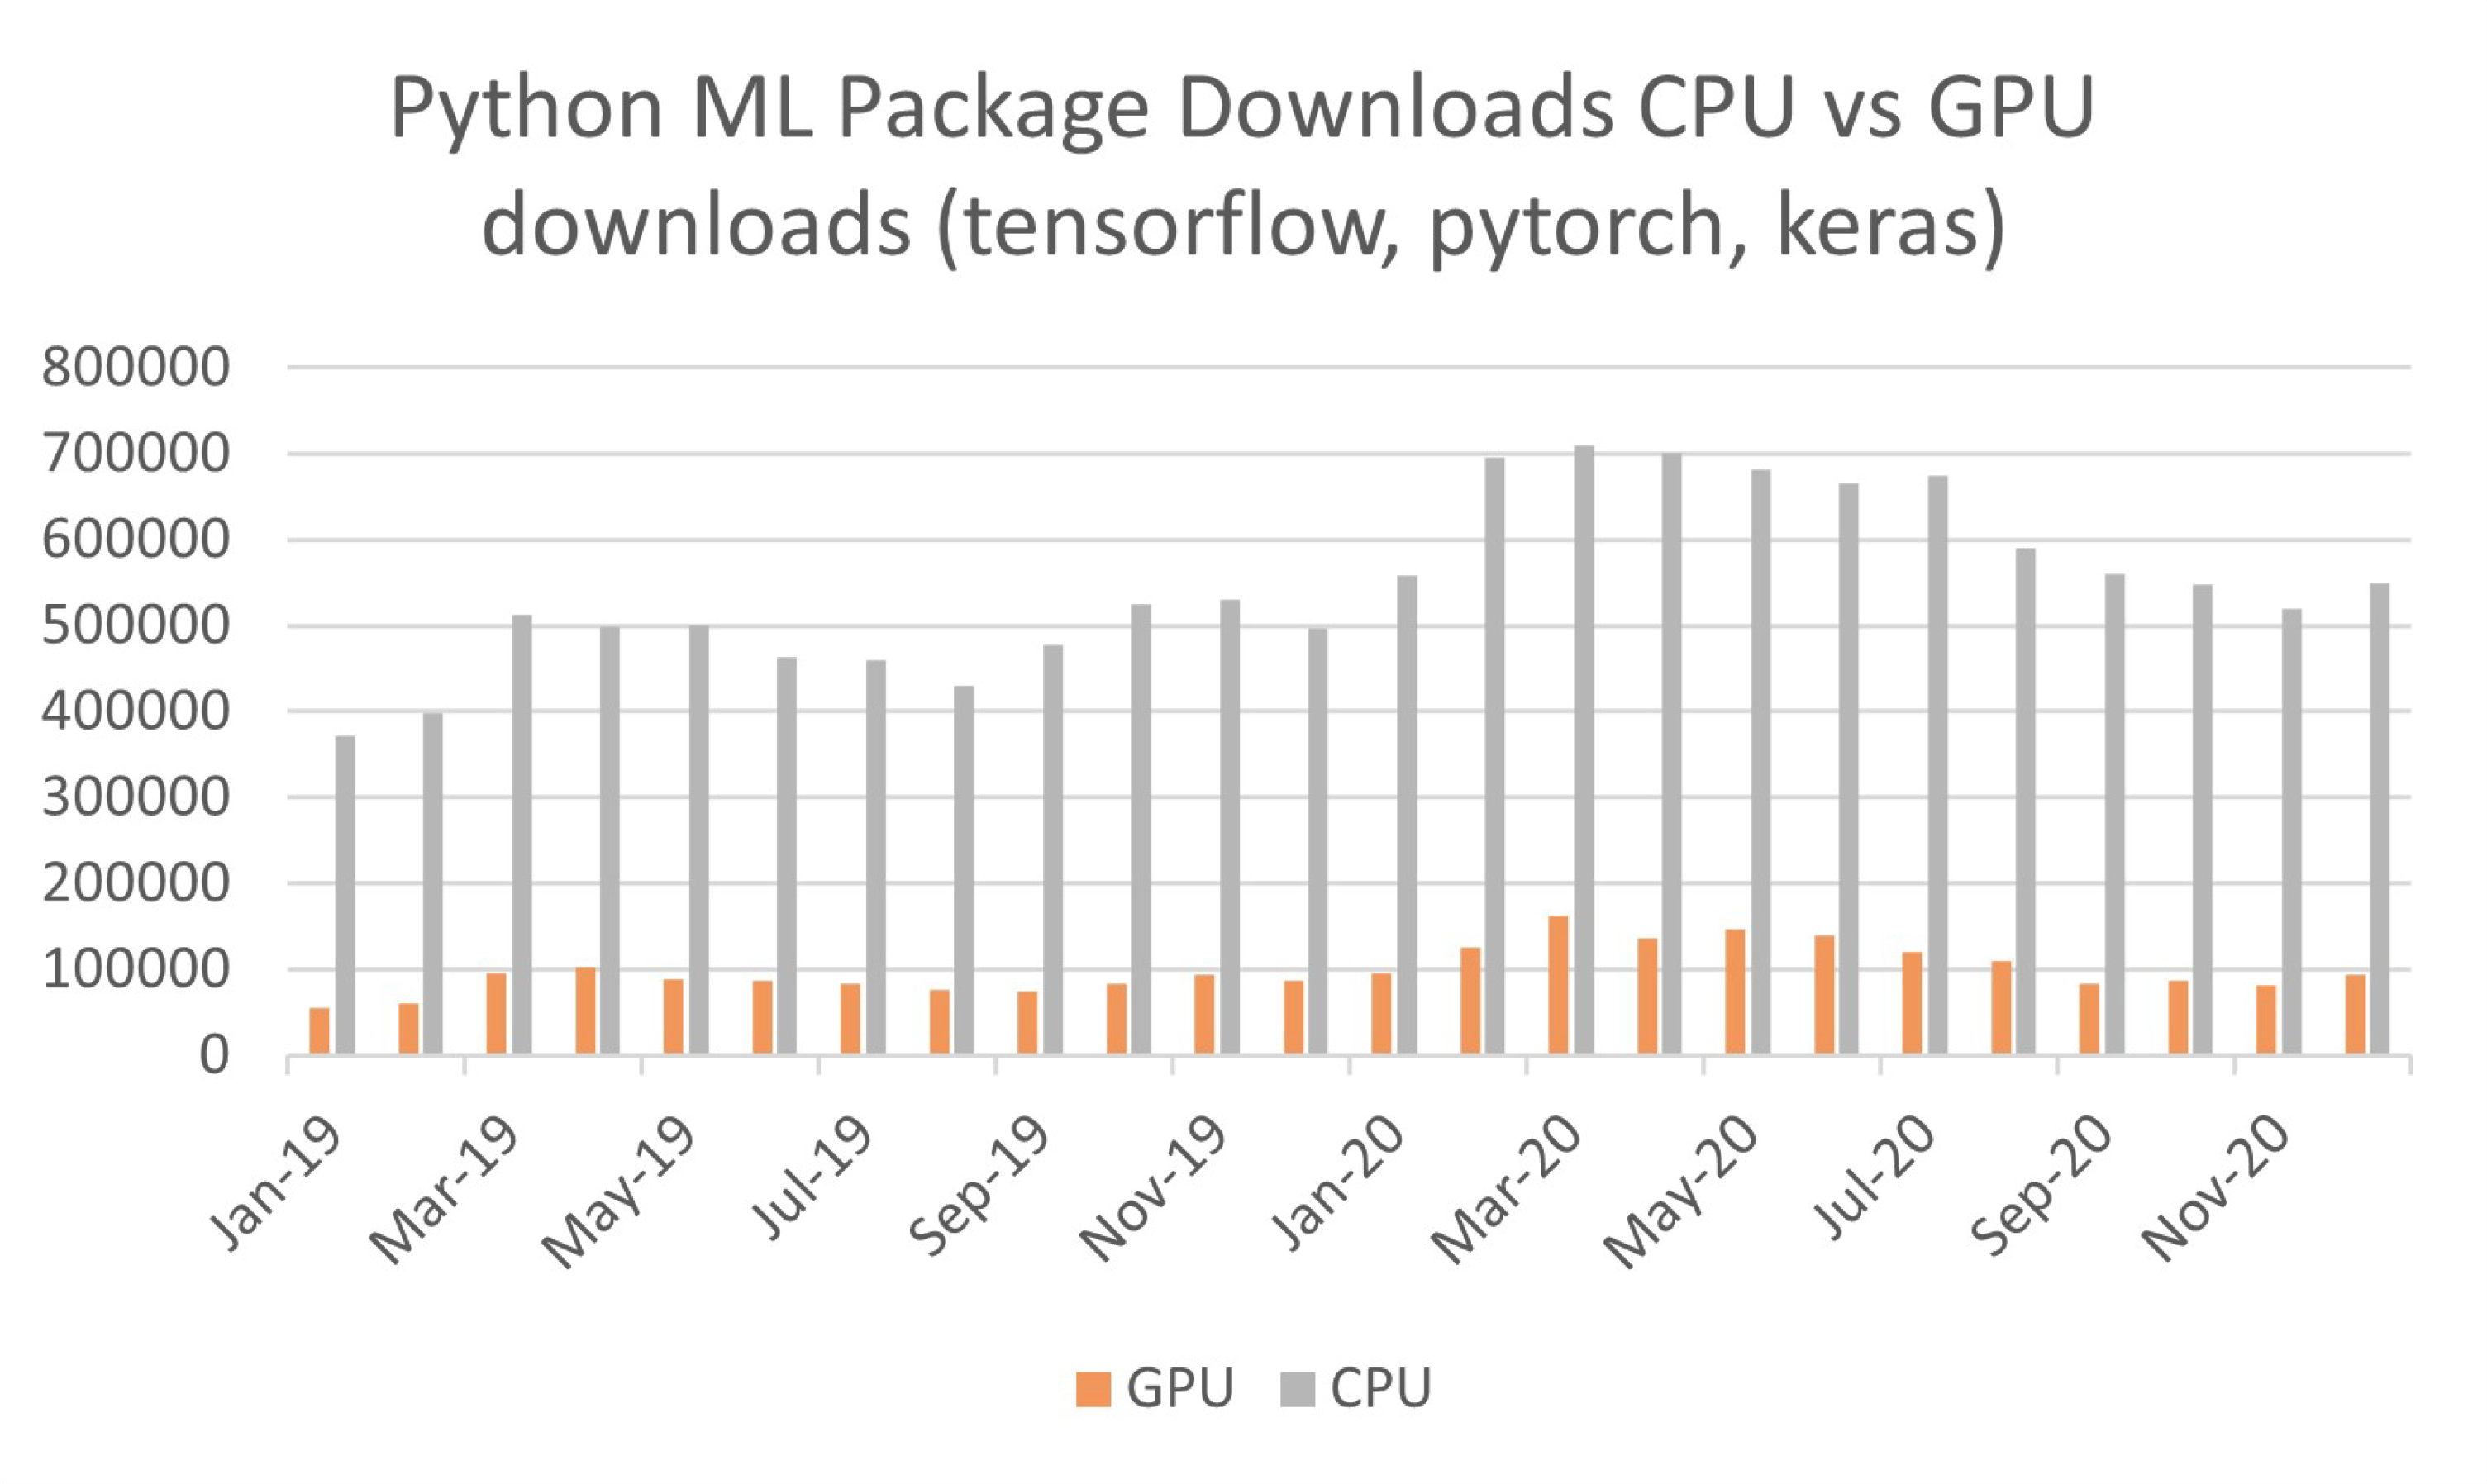
This would seem to confirm our hypothesis that the decline in search behaviour is correlated with downloading and installing certain popular ML packages during COVID-19. Moreover, these effects likely stem from pandemic-related lockdowns and restrictions on business, workers’ health and wellness, and supply chain disruptions that have led to a shortage for and significant price increase for GPUs and other high performance chips.13
8https://keywordseverywhere.com/
9Google trends data is normalized according to the following procedure
https://support.google.com/trends/answer/4365533?hl=en
10https://www.anaconda.com/blog/get-python-package-download-statistics-withcondastats
11https://www.anaconda.com/about-us
12https://towardsdatascience.com/which-python-package-manager-should-you-used0fd0789a250
13https://www.pcmag.com/news/prices-for-nvidia-rtx-3000-graphics-cards-aregetting-insane-on-ebay